Promoted Content
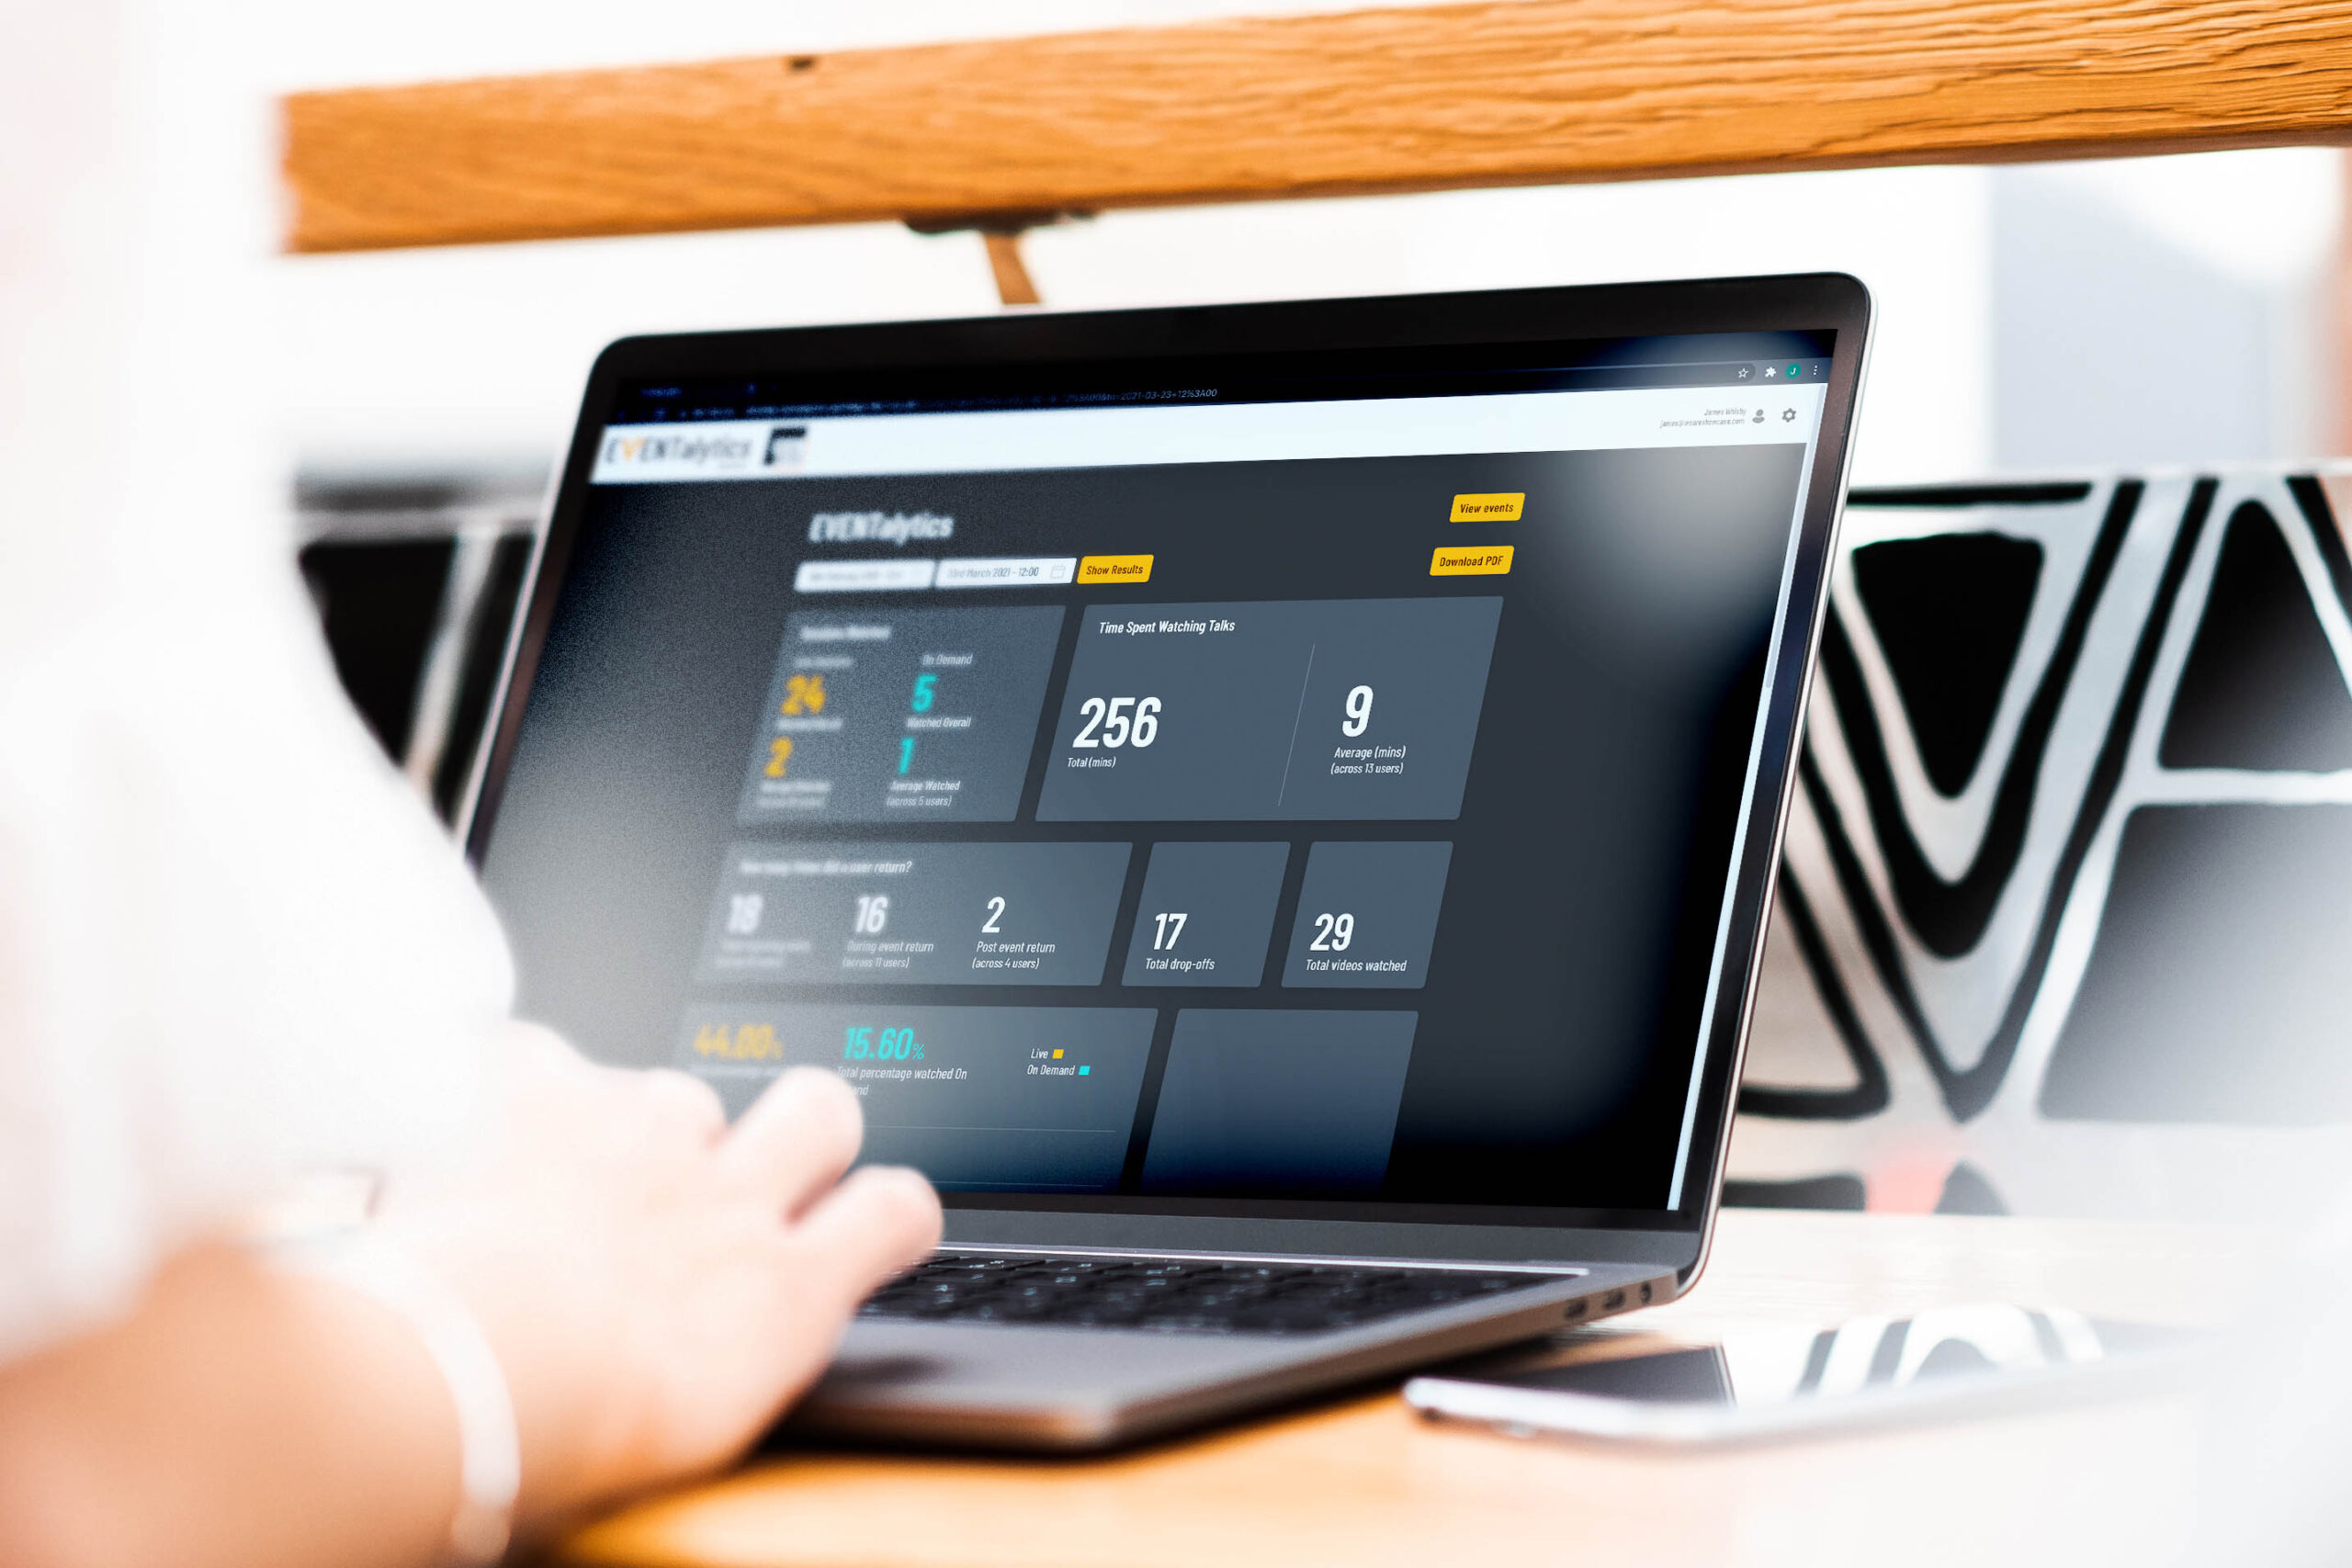
Post virtual or hybrid event data has traditionally been indigestible or difficult to understand or use in any meaningful way. Not now, thanks to Showcase’s event-specific software EVENTalytics, which works alongside their online platform to provide data that is easy to read and accessible.
Ben Collings, Showcase’s founder and managing director comments: “Event data and statistics are nothing new, but the way EVENTalytics presents them is, we’ve all seem reams and reams of raw data which basically goes unused as no one really knows what to do with it. Now with our new software that is about to change; we’ve designed EVENTalytics to work in tandem with our online platform, so giving our clients a complete virtual event package.”
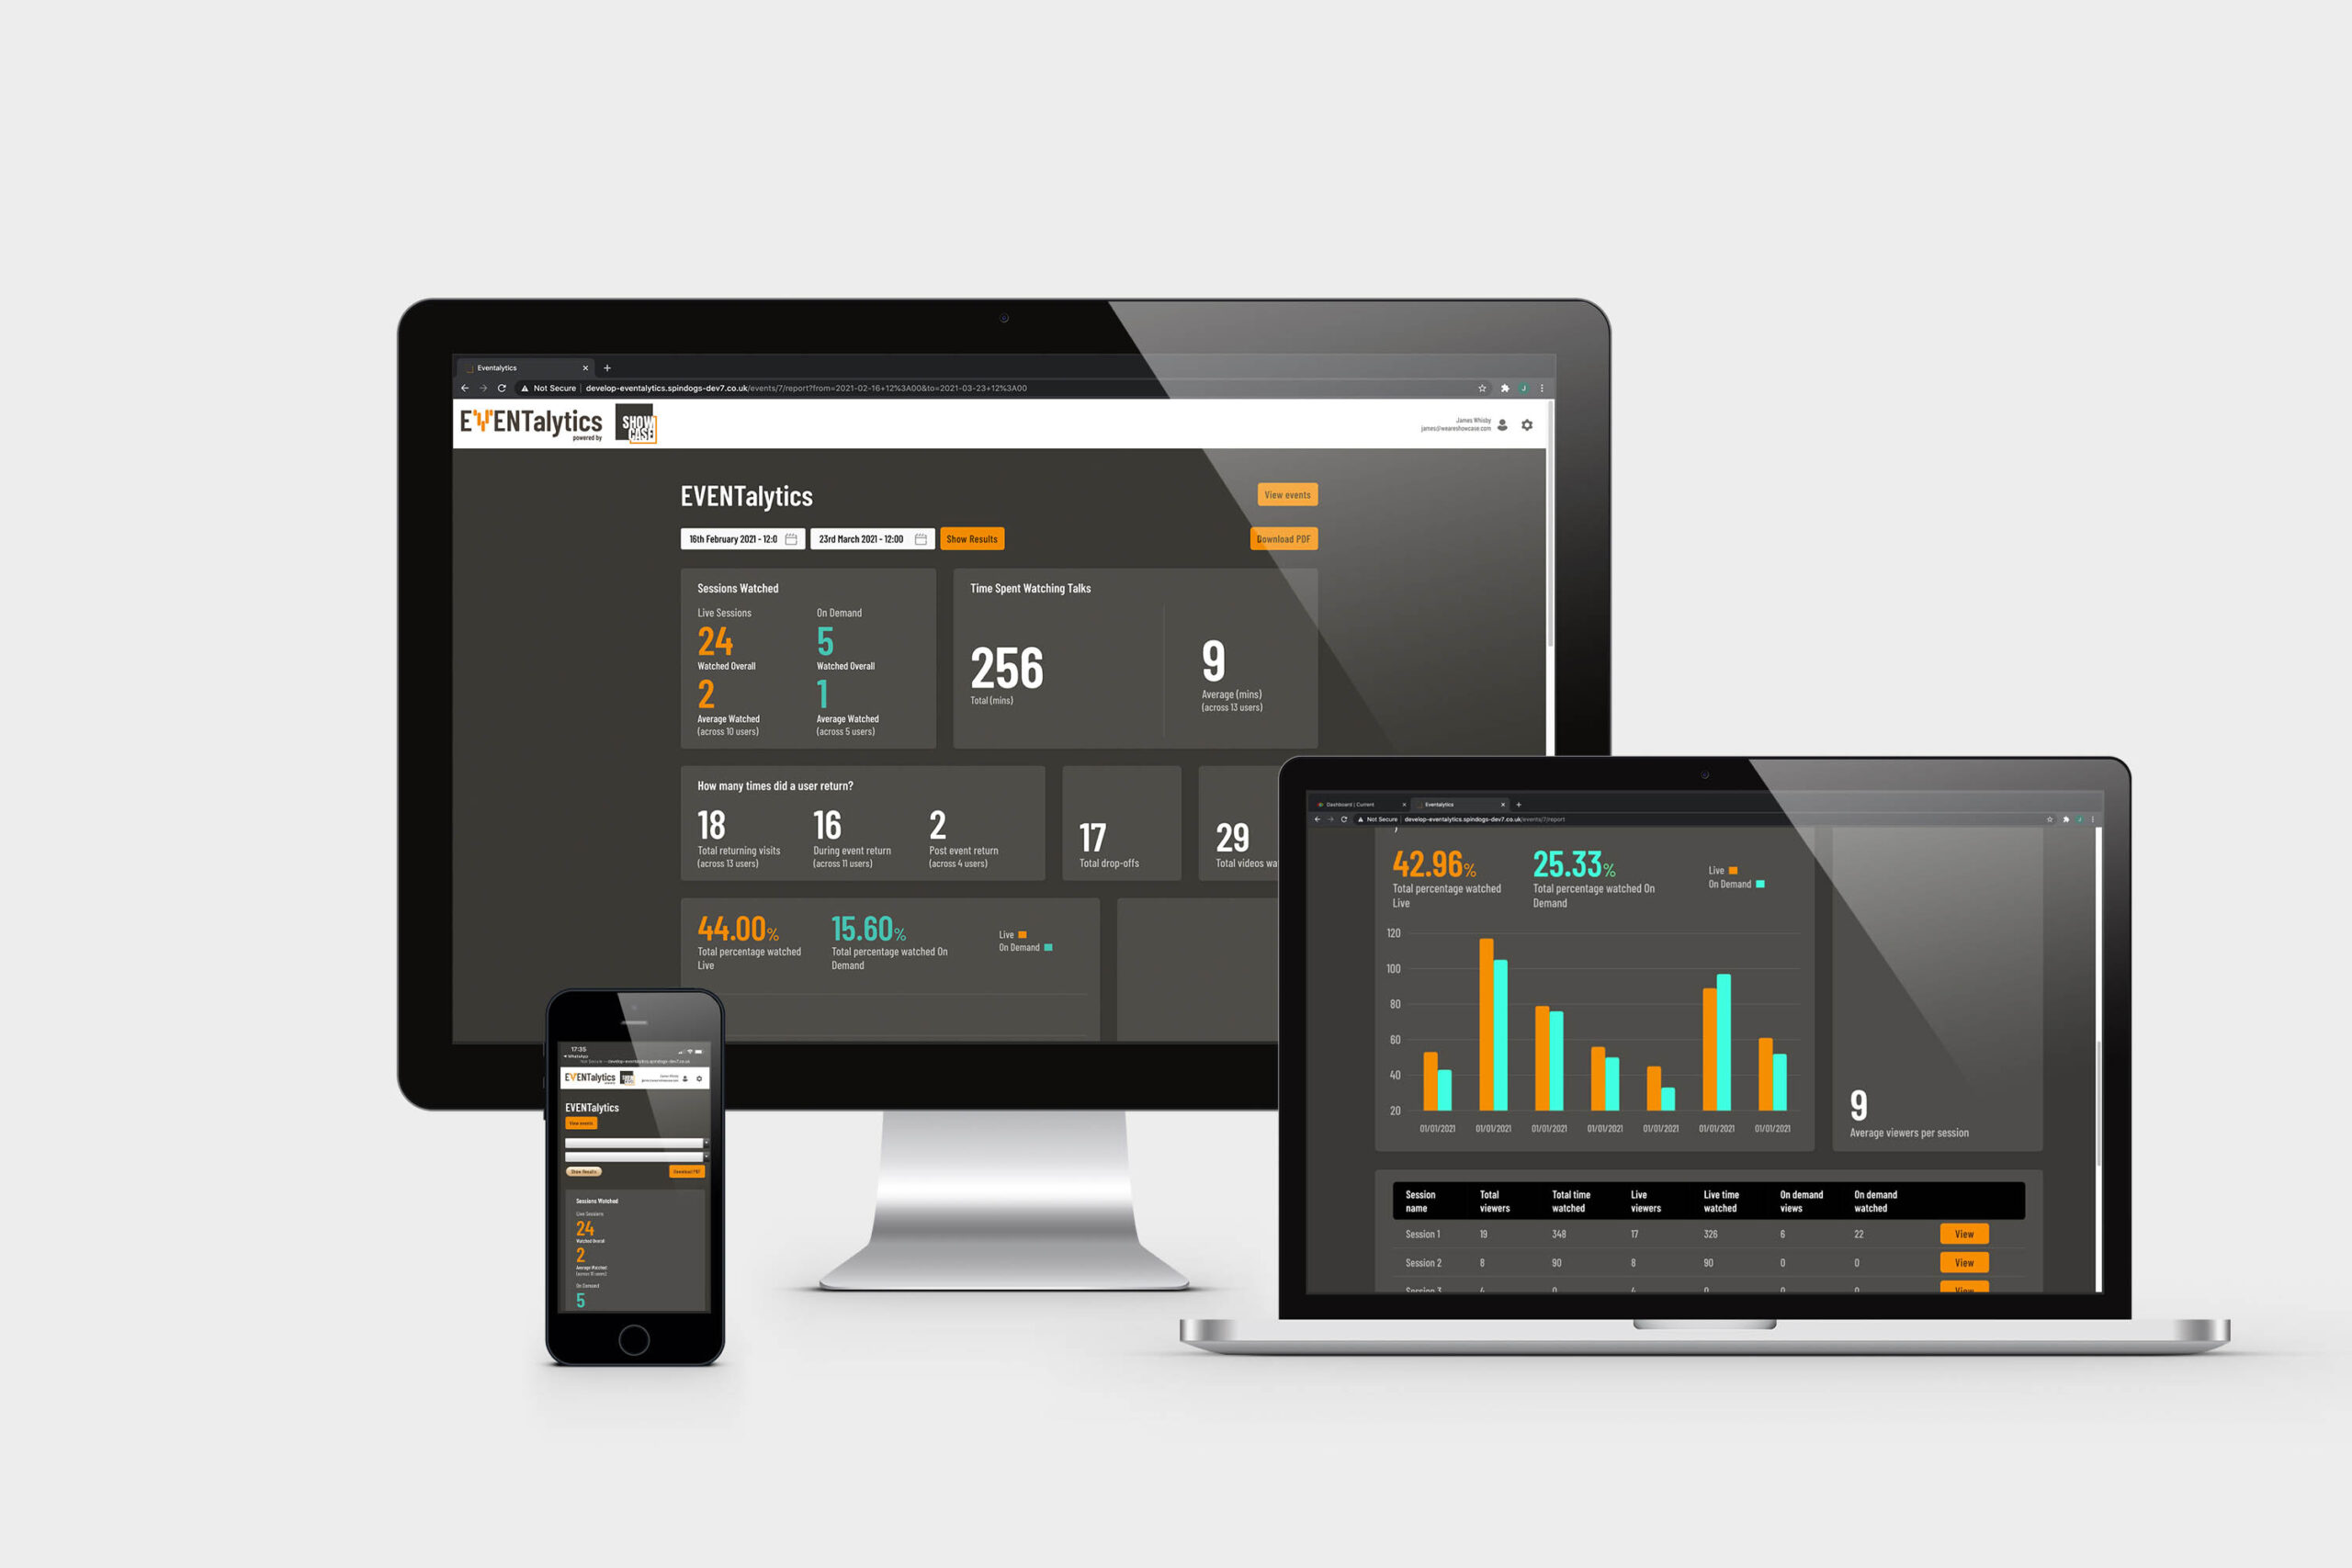
Showcase’s event platform, EVENT@, tracks attendees’ movement while on the event, tracking what people have watched and for how long, as well as giving vital information about the delegates themselves such as geographical location and job role.
EVENTalytics then gives event professionals what they really want, analytics of the data, presented in easy to adsorb reports, top level graphs and tables rather than lines and lines of raw data.
Collings adds: “Event professionals are busy people and always looking for ways to save time, so another benefit of EVENTalytics is that the professional reports can be used as presentations to sponsors and stakeholders, showing them their return on investment. Another use is using them to secure future event sponsorship.”
More details can be found on Showcase’s website.